UK waste data insights
How much waste does the UK generate every year? What is it made of, where does it come from, and where does it go?
We look at the official government statistics and answer these questions and more!
💡 Key takeaways:
- The UK generates 222.2 million tonnes of waste annually (growing by 0.6% annually over the last two decades).
- Construction waste accounts for two-thirds of this, with commercial, industrial, and household waste making much of the rest.
- There are over 4,000 waste management facilities in the UK, including landfills, incinerators and recycling plants.
How much waste does the UK generate?
Based on 2018 figures (the most recent available), the UK generates around 220 million tonnes of waste annually. This number has been increasing, with an average growth of 0.6% yearly for the past two decades. This may sound like a little but its in fact at least one million extra tonnes of waste every year.
This includes waste from all sectors of the economy, even niche ones such as dentistry amalgam waste, waste cooking oils and Sellafield‘s radioactive waste. These are the major sectors:
| Sector | Waste Generated (million tonnes) | Percentage of Total Waste |
|---|---|---|
| Construction, Demolition, and Excavation (CD&E) | 137.8 | 62% |
| Commercial and Industrial (C&I) | 42.6 | 19% |
| Households | 26.4 | 12% |
| Other (Mining, Agriculture, Forestry, Fishing) | 15.4 | 7% |
| Total | 222.2 | 100% |
Source: UK Statistics on waste
What types of waste are generated in the UK?
The bulk of the UK waste stream comprises mineral (e.g., bricks, cement, concrete, etc) and soil (excavation) wastes from the construction and demolition industry.
This is in contrast to the more newsworthy wastes the media usually reports on, such as plastics and electronics, which barely figure in the total statistics:
| Material | Total (Tonnes) | Proportion (%) |
|---|---|---|
| Mineral wastes (i.e. concrete, bricks, boulders, armourstone, mining waste). | 80,373,733.67 | 36% |
| Soils | 58,521,715.87 | 26% |
| Household & similar wastes | 28,538,399.88 | 13% |
| Other wastes | 13,317,280.02 | 6% |
| Dredging spoils | 11,318,836.60 | 5% |
| Paper & cardboard wastes | 8,249,633.29 | 4% |
| Metallic wastes | 7,980,876.89 | 4% |
| Vegetal wastes | 5,805,692.33 | 3% |
| Wood wastes | 3,998,436.13 | 2% |
| Glass wastes | 2,211,513.42 | 1% |
| Plastic wastes | 1,857,236.58 | 1% |
| Total | 222,173,354.68 | 100% |
Source: UK waste statistics
Here are some additional insights for each individual major waste type in this stream:
Construction, demolition and excavation waste statistics
Interestingly, the vast majority (92.6% in 2020!) of the UK construction waste is “recovered”. In other words, it is re-used on-site, stored for other sites, or repurposed/recycled/downcycled into other materials like aggregates, wood chips for biomass, and brick chips.
The UK boasts one of the highest recovery rates in the world, much higher than the US (70 – 75%) or China (50 – 60%), which can be attributed to stringent waste regulation inherited from the EU and the landfill tax.
This also means that, surprisingly, it’s amongst one of the most circular waste streams!
💡 While mostly inert ‘ground and dirt’, construction waste also includes niche hazardous materials like asbestos, which are costly and difficult to manage.
Paper and cardboard waste statistics
Approximately 80% of all paper products made in the UK are produced using recovered paper. This is possible because the UK’s average recycling rates for paper and cardboard are as high as 70%.
Making cardboard from cardboard waste is significantly more environmentally friendly as it uses significantly less natural resources such as wood materials and water.
Metal waste statistics
Despite representing a mere 4% of the total waste stream, metal waste is extremely valuable because of the general scarcity of metals as a natural resource and the huge amounts of energy required to extract them.
For this reason, recycling rates for metal packaging were as high as 76% in 2021. Additionally, the UK exports hundreds of thousands of tonnes of scrap metal and aluminium waste annually, generating millions of pounds in waste export profits.
💡 E-waste: Electronic waste is typically excluded from this category due to its composite nature, including plastics and other components, despite being a valuable source of precious recycled metals.
Food, garden and agricultural waste statistics
The proper management of garden, agricultural and food waste is essential. Doing so yields incredible natural resources; not doing so yields harmful greenhouse gases.
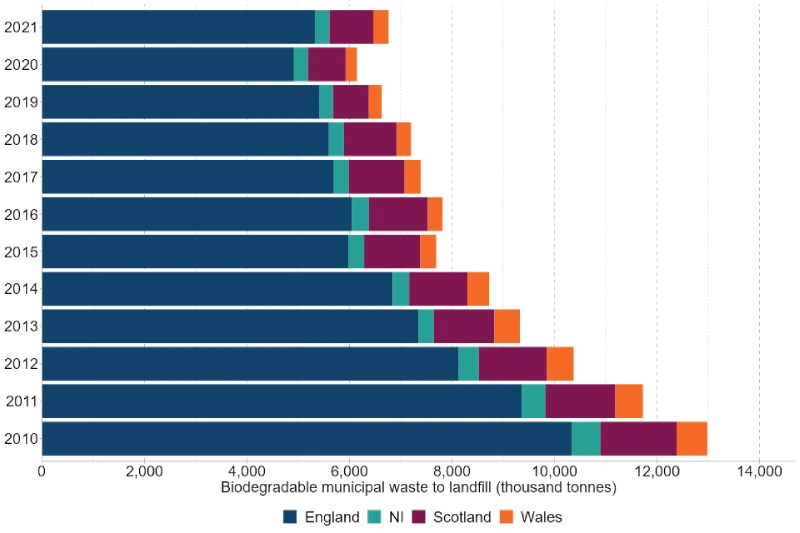
Fortunately, improvements in composting rates and anaerobic digestion capacity, and the incineration of biodegradable municipal waste have greatly reduced its influx into landfills by about half in ten years, as evident from the graph below:
💡 Biobean: Much of the spent coffee from city coffee shops in the UK used to go to landfills, but over the last decade, more and more is going towards making solid biofuels used as a replacement for coal and wood. They’ve also arranged commercial food waste collection to ensure proper segregation and disposal.
Agricultural waste remains a largely unaddressed problem. UK farms waste about 3 million tonnes of edible produce annually, accounting for about 10% of agricultural emissions! This highlights the importance of waste minimisation in effective waste management.
💡 Use our waste emissions calculator to estimate how your business’s or household’s waste contributes to climate change!
Wood waste statistics
Half of the wood waste in the UK comes from construction and demolition activities (e.g., lumber, plywood, and wood trim). Industrial processes (e.g., sawdust, pallets, crates), household items (e.g. furniture, cabinetry) and agricultural waste (e.g., pruning’s, wood debris) comprise the remaining sources of wood waste.
The good news is that the vast majority (97%) of this wood waste is “processed” (i.e. collected, sorted, and treated for recovery or recycling) and used as follows in 2023:
| Usage | Percentage of Processed Wood Waste | Description |
|---|---|---|
| Large-scale Biomass | 63% | Used for generating low-carbon energy in large biomass plants |
| Panel Board Production | 22% | Used in the manufacture of panel boards like particleboard and MDF |
| Animal Bedding, Equine Surfacing, and Other Recycling | 8% | Used for animal bedding, equine surfaces, and other recycling and reuse |
| Exports/Imports Net | 5% | Net amount exported or imported, mainly for biomass fuel in Europe |
| Small-scale Biomass | 2% | Used in small-scale biomass energy projects |
Source: Wood Recyclers Association
Glass waste statistics
Glass makes up 2% of the UK’s total waste tonnage and boasts a very high recycling rate of around 79% because it can be recycled into new glass with minimal loss. This makes glass for a commercial glass recycling facility much cheaper than glass from virgin sand.
Most glass waste comes from bottles (categorised as packaging). The amount of glass waste is increasing year-on-year, as glass packaging is seen as a much environmentally friendlier alternative due to high recycling rates, and its inertness compared to plastics.
Plastic waste statistics
Although plastic waste accounts for only a small percentage of total waste (1%), its visually significant impacts make it more immediate and relatable to the public. Examples include its detrimental effects on marine wildlife, microplastics, and littering in natural landscapes.
There have been efforts to reduce the amount of single-use and hard-to-recycle plastics, such as bans and restrictions introduced in 2023 by UK commercial waste regulations. Improvements in plastic recycling and incineration (i.e. plastics are brilliant fuel sources) have caused a reduction of plastic wastes reaching landfills.
However, UK households discard an estimated 90 billion plastic pieces annually, with only 17% recycled domestically and the rest destined for waste exports.
How many waste management facilities are there in the UK?
The UK has around 4,043 waste management facilities to handle the annual outputs. This includes landfills, incinerators and recycling facilities, as per the table below:
| Facility Type | Number of facilities (2020) | Remaining capacity (volume or tonnage) |
|---|---|---|
| Material Recovery (incl. backfilling) | 3,279 facilities | n/a |
| Landfills | 621 facilities | 427.2M m3 |
| Waste incinerators | 100 facilities | 14.5M tonnes/yr |
| Waste-to-Energy incinerators | 43 facilities | 12.1M tonnes/yr |
Source: UK waste statistics
Have recycling rates been increasing in the UK?
The short answer to this is yes, but very slowly. At least this is the case for household waste, which DEFRA has been keeping track of since at least 2010. The following graph shows household recycling rates for each devolved nation as well as the UK as a whole:
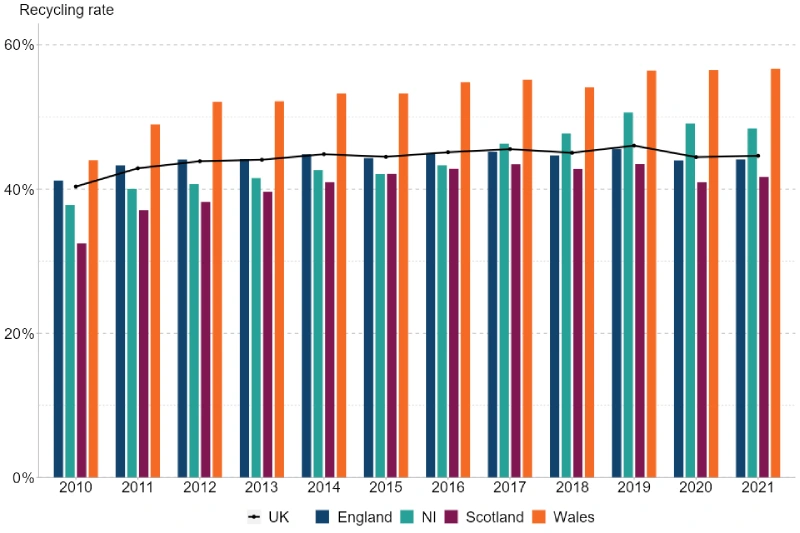
Wales is at the forefront of household recycling. Due to its progressive devolved policies, the separate collection of multiple recyclable streams is mandatory, causing recycling rates to improve significantly.
All other countries saw lesser but significant improvements, except England, which has the largest population. The result is that UK-wise, recycling rates have only increased modestly from 40% to 44% in a decade.
💡 Check out our article, ‘recycling processes for common waste types‘ to find out where it goes once picked up from the kerbside.
How has waste management changed in England?
The reason behind the ‘modest’ improvement in recycling of household waste in the UK is perfectly exemplified by the trends seen in England, which represents 84% of the total population:
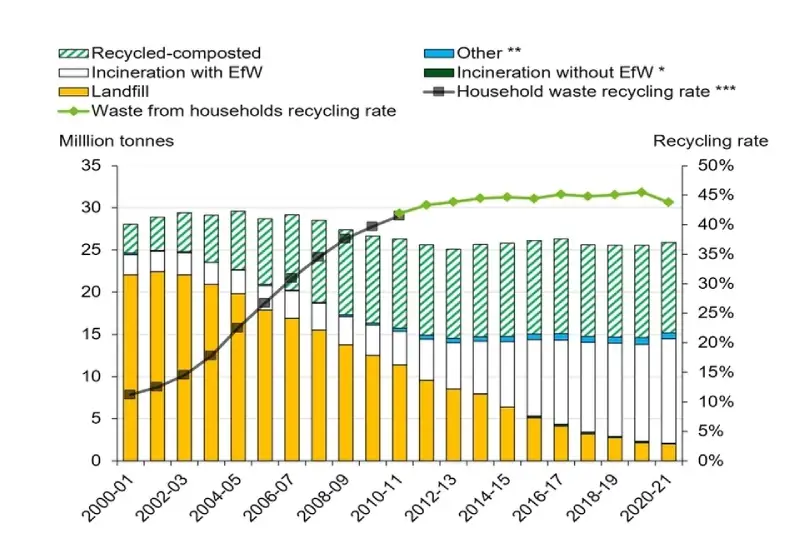
Based on official government data, the graph shows a dramatic increase in recycling rates until about 2010, when incineration rates started to pick up. The UK government shifted its landfill reduction strategy from increasing recycling rates to increasing incineration.
So, while England managed to reduce landfilling from about 22% to 3% in two decades, this was due mostly to recovering energy from waste and not through recycling.
Other interesting waste statistics
Here are some additional waste statistics that may be interesting to you:
Wind blade recycling
The sheer growth of wind power in the UK is now yielding large numbers of disused composite wind blades for recycling. The media makes this a larger problem than what it truly is. Despite its lack of recyclability, wind blades present a diminutive amount of mostly harmless, inert, non-toxic waste compared to the total UK waste streams.
Fly-tipping statistics
2022-23, over one million fly-tipping incidents were reported in England. The issue is worst in urban areas, with roadsides, alleyways, and footpaths being the most common places for fly-tipping. Most incidents are small volumes: single items, a plastic bag, or dumps that usually fit in a car or utility van. This shows how offenders are usually small businesses and homes. Most fly-tipped waste is household waste!
- Share: